The Legend of Zelda: Majora's Mask/Crash Debugger
This is a sub-page of The Legend of Zelda: Majora's Mask.
Majora's Mask contains a crash debugger just like Ocarina of Time does. It was used by the game developers to diagnose crashes that occur, and is expanded a lot compared to OoT's crash debugger.
It is present in all N64 versions of the game. To trigger it, you first need to crash the game in some way, either by using one of the game's various glitches or by Crooked Cartridge if you're desperate enough to damage the cart. Once a crash is triggered, the game will alternate between the last two framebuffers before showing the last "blended" frame (used for blur effects like the title screen cutscene), and displaying a color bar which indicates the type of crash that occurs. Now, you need to type in the following button combination:
D-Pad Left + C-Right + L + R + Start
That's it. No finger breaking is necessary, unlike in OoT.
The crash debugger will usually execute correctly on emulators, but HLE emulators will not display the crash screen because they utilize an external framebuffer to allow for upscaling. Due to the differences between the N64 and the GCN the crash debugger does not work on the GCN version of MM.
Contents
Register Dump
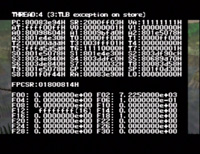
Both OoT and MM use the same first screen. This is the most important one, as it provides the most basic information concerning the status of the system at the time of the crash. Most (if not all) of the information shown comes from a register, either on the System Control Processor (top), the main CPU, or the Floating-Point Unit (bottom).
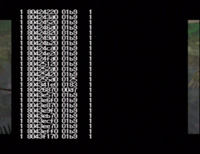
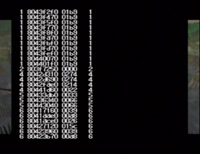
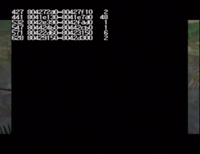
Stack Trace 1
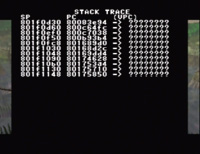
This screen displays the call stack before the exception occurred. The first row shows the current Stack Pointer (SP) and Program Counter (PC) at the time of the crash, while subsequent rows represent different function calls that lead to the faulting code. The Virtual PC (VPC) column shows the virtual address conversion of the PC. Virtual addresses uniquely identify portions of code that can be dynamically allocated (actors for instance).
In general, the smaller the SP value, the larger the Stack (i.e. more stuff that's on it). This may not always be the case true however, as the SP has been observed to jump from $801xxxxx to $807xxxxx. This probably happened because the Stack was getting too big for where it was, so the new data was placed on the Expansion Pak where it could fit.
The number of lines on this screen vary, for unknown reasons.
Thread hangup screen
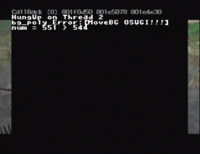
This screen is uncommon but can appear. For example, it can appear after crashing in the defective Snowhead Temple with Epona. The screen shows a second thread ID (usually 2, for some reason), as well as the source code filename responsible (such as "../z_std_dma.c"). This screen probably appears if the program crashed in a piece of code that had debug information embedded in it.
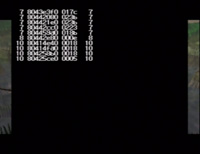
Actor List (Instances)
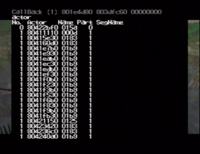
Lists the starting point of every actor instance loaded in memory at the time. Interestingly, the actor number (to the right of the start address) is listed in hexadecimal, rather than decimal as was done on the next screen and in OoT.
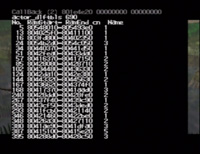
Actor List (Code Files)
Lists the start and end points of the actor overlay (code) files currently loaded. The right column is the number of instances of that actor loaded.
Screenshots
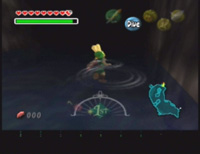
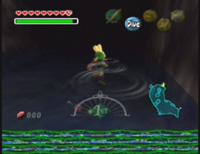
At this point, the debugger takes a moment to show two screenshots from the moments leading up to the crash. The last two frames drawn to the screen are displayed, with the most recent coming last. The two are often the same image, with maybe a slight difference in one of the icons on the screen.
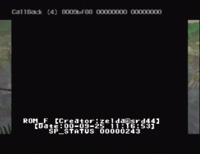
Version Info
No debugger is complete without this, it seems. During development, there may be several different builds going around at once, so having a specific version dated can sometimes be helpful. Also on the screen is something labeled "SP_STATUS", which possibly has something to do with the Stack.
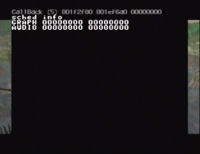
Scheduling Info
This screen isn't well understood. There are always two lines, GRAPH and AUDIO. However, sometimes another block of information appears, called RSPTask. The odd thing about this last bit of information is that not only doesn't always appear, but sometimes decides to appear randomly during the same debug session!
This screen probably relates to thread/task scheduling (GRAPH(ics) and AUDIO being two task names).
Dump
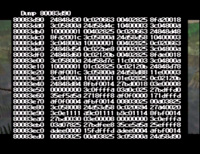
This is the generalized version of the two dump screens of the OoT debugger. Here, you can examine anything that's stored in RAM. Here are the controls for the dump screen:
- Up, Down = scroll one line, or $10 (16 bytes)
- A + Up, Down = scroll a distance of $100 (256 bytes)
- B + Up, Down = scroll a distance of $1000 (4096 bytes, or 4KB)
- A + B + Up, Down = scroll a distance of $10000 (65536 bytes, or 64KB)
- C Down = Jump to the Stack (stack dump)
- C Up = Jump to the section of code that caused the crash (PC dump)
- C Left, C Right = scroll to $80000000 (start of RAM)
- START = exit the Dump screen
Stack Trace 2
This is pretty much identical to the first Stack Trace, only the final column is different. On the first screen, the third column seems to always be "????????." However, on this screen the ? marks will occasionally be replaced with a pointer value in the range $8080xxxx, outside of the physical RAM space. One possibility for this is that this screen could be converting the true ram addresses of a function stored within an of an overlay file back to their virtual ram addresses.
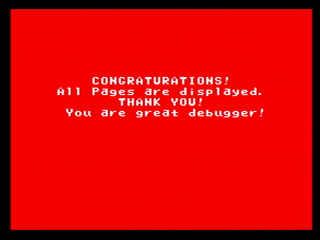
CONGRATURATIONS
Of course, the debugger has to provide some congrats for anyone serious enough to actually mess around with these screens. Notice how the word congratulations is misspelled. Was that intentional, or a translation error? Who knows. After all, it is a debugger, so why should everything be perfect? It should be noted that this appears in Doubutsu no Mori's crash handler, with the same misspelled word.
