Call of Duty: Modern Warfare 2 (Windows)/Debug Material
This is a sub-page of Call of Duty: Modern Warfare 2 (Windows).
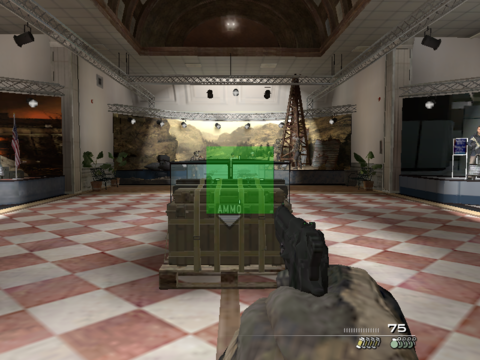
This page is dedicated to the debugging content from Call of Duty: Modern Warfare 2. They can be accessed using console commands or modding.
| To do: Get more debugging commands. There is probably more than this. |
Contents
Crash Debugger?
| This needs some investigation. Discuss ideas and findings on the talk page. |
It turns out the game has a built in crash debugger that can pop up if certain fatal errors occur during game play. For example, the debugger will not pop up if the game can't find the .ff of a map when it is trying to load it, but it will pop up if the game can't find the .d3dbsp of a map while loading that map.
If the player were to use a modified executable (specifically, one that adds the developer console back into the Singleplayer section of the game), they would be able to access the debugger by simply pressing F1 in-game. This would pop up the same window but the player is actually able to enter commands into a text box and see anything that is being logged.
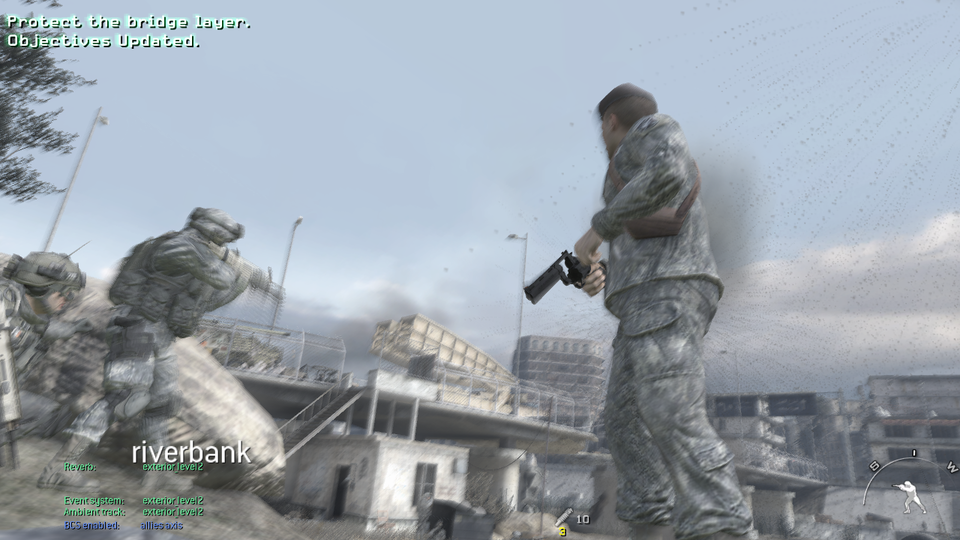
developer_script
To access this, go into the developer console and type /developer_script 1. Enables developer script comments.
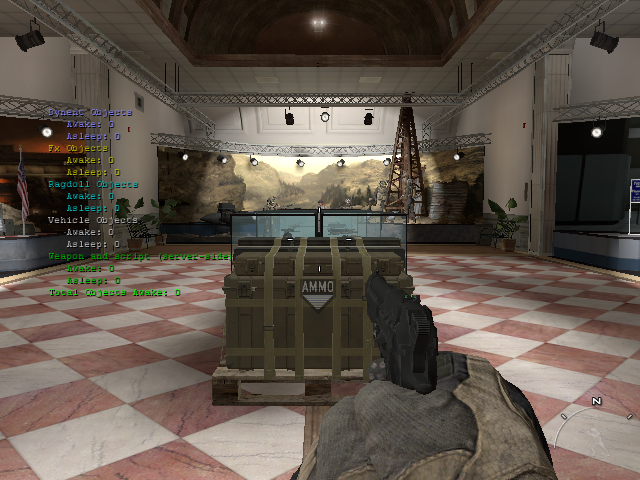
phys_drawDebugInfo
To access this, go into the developer console and type /phys_drawDebugInfo 1. Below is the result. Judging from this command's name, it would definitely have been used to debug the physics engine or something that had to do with the physics. Prints info about the physics objects.
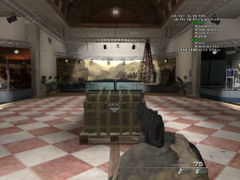
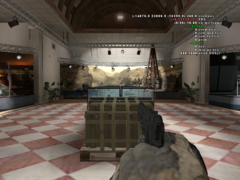
cg_drawFPS
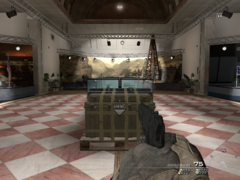
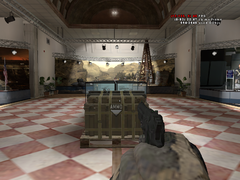
To access this, go into the developer console and type /cg_drawFPS *. Replace the * with either 1, 2, 3, or 4. Below are the results for each number.
| Number 1 | Number 2 | Number 3 | Number 4 |
|---|---|---|---|
 |
 |
 |
|
ui_debugMode
| To do: Get more screenshots - there is way more than this. |
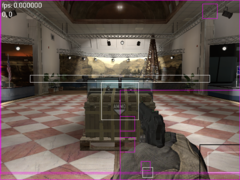
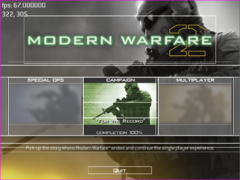
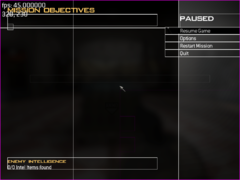
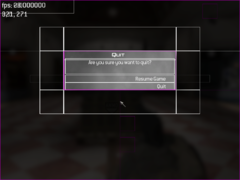
ui_debugMode applies an overlay to the in-game UI that outlines every element in the menus and HUD. You can enable it by entering /ui_debugMode 1 into the developer console and hitting enter.
| In-game | Main Menu | Pause Menu | Quit Prompt |
|---|---|---|---|
 |
 |
 |
|
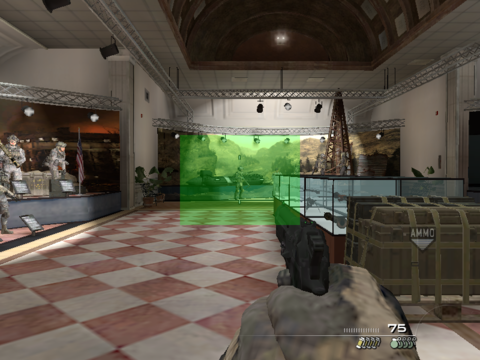
aim_autoaim_debug
To access this, go into the developer console and type /aim_autoaim_debug 1. Below is the result.
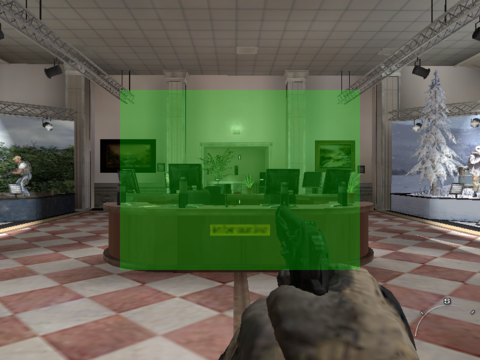
aim_automelee_debug
To access this, go into the developer console and type /aim_automelee_debug 1. Below is the result.
aim_lockon_debug
To access this, go into the developer console and type /aim_lockon_debug 1. Below is the result.
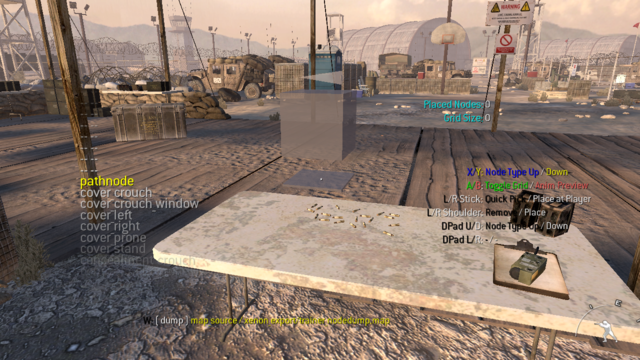
noder
The game has a debugging mode known internally as the "Noder". It completely disables the campaign objectives and scripting, meaning no characters actually spawn in. Because it requires an Xbox 360 controller to interact with the menu, it doesn't work correctly on the Windows version. It can be accessed using the console command exec noder and then restarting the map.

